Tracking the right lead conversion metrics can transform your sales process. Without them, you’re guessing why leads don’t convert. Did you know that responding to a lead within a minute can increase conversions by 391%, yet most teams take 42 hours? Or that companies aligning sales and marketing see a 32% revenue boost?
Here are the 5 key metrics every team should monitor:
- Lead Conversion Rate: Percentage of leads that move forward in the funnel.
- Lead-to-Sale Conversion Rate: How many leads turn into paying customers.
- Lead-to-Opportunity Conversion Rate: Leads progressing to the opportunity stage.
- SQL Conversion Rate: Sales Qualified Leads becoming opportunities or customers.
- Lead-to-Customer Ratio: Total leads that become paying customers.
These metrics reveal where your funnel leaks, highlight lead quality, and help you forecast revenue accurately. Using tools like HubSpot or Salesforce can simplify tracking through automation and real-time dashboards. Focus on these numbers, and you’ll know exactly where to improve.
Sales Lead Conversion Rate: Formulas, Metrics, and Tricks for Making the Most of Every Lead
sbb-itb-8aac02d
1. Lead Conversion Rate
Lead conversion rate shows the percentage of leads that either turn into customers or move further along the sales funnel. The formula is simple: (converted leads ÷ total leads) × 100.
For instance, if you brought in 500 leads last month and 25 of them converted, your conversion rate would stand at 5%. Generally, across industries, conversion rates hover between 2% and 5%. In the B2B world, the range is slightly higher, typically between 5% and 10%, with anything above 15% being considered exceptional.
Impact on Sales Performance
A strong conversion rate reflects how effectively your pipeline engages potential customers. HubSpot captures this perfectly:
"Lead conversion is the measurable signal that marketing and sales activities create real business value, and reliably tracking conversions clarifies which investments produce revenue."
On the flip side, a drop in conversion rates might indicate that your team is either targeting the wrong audience or that leads need more nurturing and qualification before they’re ready to make a purchase.
Measuring Funnel Efficiency
Breaking down conversion rates at different funnel stages - like from lead to Marketing Qualified Lead (MQL) or from MQL to Sales Qualified Lead (SQL) - helps identify where prospects drop off. For example, if many leads make it to the SQL stage but few convert into opportunities, it could mean your discovery calls need improvement.
| Pipeline Stage | Expected Conversion Rate | Primary Focus Area |
|---|---|---|
| Lead to Marketing Qualified (MQL) | 40-50% | Lead scoring accuracy |
| MQL to Sales Qualified (SQL) | 60-70% | Discovery call quality |
| SQL to Opportunity | 75-85% | Needs assessment process |
| Opportunity to Closed Won | 30-40% | Proposal and negotiation skills |
Source: monday.com
Role in Pipeline Forecasting
Tracking your conversion rate consistently creates a baseline for revenue forecasting. It helps you estimate how many leads you’ll need to reach your sales goals.
Assessing Lead Quality Effectively
Analyzing conversion rates by marketing channel - whether it’s organic search, paid ads, or referrals - helps reveal which sources bring in actual buyers. A channel with a lot of leads but a low conversion rate might not be as valuable as one with fewer leads but a higher conversion rate. This insight allows you to allocate your marketing budget to the channels that truly drive revenue.
These metrics lay the groundwork for how CRM tools can further fine-tune your tracking and strategy.
2. Lead-to-Sale Conversion Rate
The lead-to-sale conversion rate shows the percentage of leads that turn into paying customers. It’s calculated using this formula: (Total Sales ÷ Total Leads) × 100. For instance, if you brought in 1,000 leads last quarter and closed 60 deals, your conversion rate would be 6%. This metric plays a key role in assessing how effectively your sales process drives revenue.
Impact on Sales Performance
This rate reflects how well your sales and marketing teams turn interest into actual revenue. A higher rate often means your team is focusing on qualified prospects ready to make a purchase, rather than wasting time on leads that won’t convert. In the B2B world, average conversion rates typically fall between 2% and 10%. Top-performing teams, however, can hit rates of 15% to 20%. For B2B SaaS companies, rates generally range from 5% to 10%, while enterprise-level sales often see lower rates, around 2% to 6%.
Measuring Funnel Efficiency
Tracking this metric can help you identify where prospects are dropping off in your sales funnel. As Revenue.io puts it:
"Lead conversion rate is important because it measures sales efficiency, identifies bottlenecks, and helps forecast revenue."
By analyzing each stage of the funnel, you can uncover specific weak points - whether it’s ineffective discovery calls, underwhelming demos, or poorly executed proposals.
Relevance for Pipeline Forecasting
This metric also plays a crucial role in hitting revenue goals. For example, if your conversion rate is 5% and you aim to gain 50 new customers next quarter, you’ll need to generate at least 1,000 leads. Using past data, you can refine your revenue forecasting and set realistic targets.
Effectiveness in Assessing Lead Quality
A low conversion rate paired with a high number of leads often suggests that marketing is prioritizing volume over quality. Salesforce highlights this issue:
"A company with a lower number of high-quality leads will typically have a higher conversion rate. This is because it's easier to convert prospects who are engaged with your company, need your product, and are ready and able to buy."
Breaking down conversion rates by marketing channel - like organic search, paid ads, or referrals - can reveal which sources are bringing in serious buyers versus casual visitors. This insight ensures your marketing budget is spent on channels that actually deliver results.
3. Lead-to-Opportunity Conversion Rate
The lead-to-opportunity conversion rate shows the percentage of leads that move forward to the "opportunity" stage in your sales funnel. To calculate it, use the formula: (Number of Leads Converted to Opportunities ÷ Total Number of Leads) × 100. For instance, if you generated 500 leads last month and 65 advanced to opportunities, your conversion rate would be 13%. This metric represents the moment when a lead transitions from initial interest to active consideration, marking a critical step toward closing deals. It’s a key indicator of how well your sales funnel is functioning and plays a significant role in overall sales efficiency.
Impact on Sales Performance
This metric directly affects how effectively your sales team spends its time. Converting leads too early can clog your pipeline with unqualified prospects - up to 60–70% of deals may be nonviable. On the flip side, waiting too long to convert leads could mean losing them to competitors. For B2B companies, a healthy lead-to-opportunity conversion rate typically ranges from 10–15%, with top-performing teams reaching 20–30%.
Measuring Funnel Efficiency
Monitoring this metric helps pinpoint where issues might be slowing down your sales process. Karly Wescott, Lead Growth Advisor at New Breed, highlights its importance:
"The lead-to-opportunity conversion rate is an important metric for any sales team or process, as it measures how effectively leads are being converted into opportunities - and ultimately, deals."
By analyzing conversion rates at various stages, you can uncover specific problems, such as ineffective qualification calls or unclear messaging. This insight allows you to streamline your process, making it easier to refine revenue projections and improve overall efficiency.
Relevance for Pipeline Forecasting
A stable conversion rate is essential for accurate revenue forecasting. For example, if historical data shows that 15% of your leads typically convert to opportunities, and your goal is to generate 100 new opportunities next quarter, you’d need to bring in about 667 leads. This level of predictability ensures your pipeline isn’t overcrowded with unqualified leads, helping your team focus on deals that truly matter.
Effectiveness in Assessing Lead Quality
This metric also reflects the quality of your leads. A low conversion rate paired with a high lead volume often signals that marketing efforts are prioritizing quantity over quality, requiring better sales lead generation solutions. Moreover, conversion rates can vary widely depending on the lead source: referrals typically convert at 25–40%, inbound leads at 15–25% (often driven by optimized landing pages), and outbound leads at just 3–10%. Breaking down conversion rates by source helps identify which channels attract the most engaged prospects, enabling smarter budget decisions and more targeted marketing efforts.
4. Sales Qualified Lead (SQL) Conversion Rate
The SQL conversion rate measures how effectively qualified leads move through your sales funnel. It’s calculated using two key formulas:
- SQL-to-Opportunity Rate = (Total Opportunities ÷ Total Sales Qualified Leads) × 100
- SQL-to-Customer Rate = (Total Sales ÷ Total Sales Qualified Leads) × 100
These benchmarks can vary widely depending on how your team qualifies leads and handles follow-ups. For example, average SQL-to-Opportunity rates often fall between 25% and 30%, but top-performing teams can hit rates as high as 75% to 85%. Similarly, while the average SQL-to-Customer rate is around 6%, high-performing teams might reach up to 25%.
Impact on Sales Performance
This metric is critical because it directly influences both productivity and revenue. Teams that excel in lead qualification can achieve 7× higher conversion rates and close deals 30% faster. On the flip side, failing to track this metric can lead to wasted effort, with sales reps spending nearly 40% of their time on leads that won’t convert. As Lara S. Triozzi, CEO of MarketLauncher, points out:
"Unfortunately, many businesses overlook that critical section of the funnel – the conversion from SQL to Opportunity – because they look at lead production and opportunity closing ratios in a vacuum."
Improving your SQL-to-Opportunity conversion rate to align with industry standards could increase new business revenue by as much as 20%. This highlights the importance of identifying and addressing bottlenecks in the sales funnel.
Measuring Funnel Efficiency
A low SQL-to-Opportunity rate often exposes weaknesses in your sales process. For instance, it might indicate that your qualification criteria are too broad, allowing unqualified leads into the funnel. This metric also helps pinpoint where potential customers drop off. If many prospects fail to move past initial meetings, it could mean your discovery or needs assessment process needs work. Interestingly, companies that track pipeline velocity weekly have seen revenue growth of 34%, compared to just 11% for those who track less consistently. This level of discipline not only boosts efficiency but also improves revenue forecasting accuracy.
Relevance for Pipeline Forecasting
SQL conversion data plays a vital role in refining pipeline forecasting. For example, if historical data shows that 25% of SQLs convert into opportunities - a common figure for many businesses - and you need 80 new opportunities next quarter, you’d need to generate around 320 SQLs. Having this predictability allows your team to focus on activities that drive meaningful results rather than getting distracted by vanity metrics.
Effectiveness in Assessing Lead Quality
SQL conversion rates are also a great way to validate lead scoring models and assess buyer intent. For example, B2B SaaS companies using behavioral scoring often see conversion rates of 39–40%, compared to just 13% for those relying only on demographic data. Additionally, companies using structured qualification frameworks like BANT (Budget, Authority, Need, Timeline) report a 59% increase in conversion rates. Persistence also plays a key role - research shows that 80% of sales require at least five follow-ups, yet 92% of sales reps stop after just four attempts. By leveraging SQL conversion insights, you can fine-tune lead management and set the stage for optimizing your sales pipeline management CRM best practices.
5. Lead-to-Customer Ratio
The lead-to-customer ratio tells you what percentage of your leads actually become paying customers. To figure it out, divide the number of customers by the total leads and multiply by 100. For instance, if you had 1,000 leads last quarter and 50 turned into customers, your ratio would be 5%. Ryan Flanigan, Content Marketing Manager at Method, puts it this way:
"Your ability to turn leads into paying customers is the backbone of one of the most important key performance indicators (KPIs) in business."
This metric is a key piece in understanding how well your sales and marketing efforts align.
Impact on Sales Performance
The lead-to-customer ratio highlights how effectively your sales and marketing teams are working together. Like other conversion metrics, it reflects the combined success of these departments. A high ratio means your sales team is closing the opportunities that marketing provides, while a low ratio suggests issues such as poor alignment or inefficient lead handling. Alarmingly, many sales teams waste about 40% of their time chasing unqualified leads due to a lack of real-time insights into lead quality. A strong ratio indicates that both teams agree on what makes a lead "qualified" and that your sales process is successfully converting high-intent prospects.
Measuring Funnel Efficiency
This ratio also sheds light on where prospects are dropping off in your sales pipeline. If you're generating plenty of leads but few are converting, it points to a revenue leak that needs attention. By identifying where leads stall, you can refine your approach and ensure you're holding on to every viable opportunity.
Relevance for Pipeline Forecasting
Think of this ratio as your guiding metric for revenue planning. Knowing your historical conversion rate lets you predict future sales based on current lead volume. For example, if your lead-to-customer ratio is consistently 5% and you aim to gain 100 new customers next quarter, you'll need to generate 2,000 leads. This predictability helps you set realistic revenue goals and allocate marketing budgets effectively. In short, understanding this metric keeps your revenue strategy focused on high-quality leads.
Assessing Lead Quality
Breaking your lead-to-customer ratio down by source can reveal which channels are delivering real buyers. A channel might produce hundreds of leads, but if none convert, it’s not worth the investment. Industry averages can provide benchmarks: Professional Services often see a 10% conversion rate, Healthcare and Education around 8%, Technology/Software at 7%, Financial Services at 5%, Real Estate at 4%, Retail at 3%, and E-commerce at 2%. If your ratio stays low despite a high volume of leads, it could signal that you're prioritizing quantity over quality. Additionally, nurtured leads tend to spend 47% more on purchases than non-nurtured ones, underscoring the importance of lead qualification and nurturing.
How CRM Tools Help Track These Metrics
Modern CRM platforms make it easier than ever to track and manage leads as they move through your sales pipeline. Tools like HubSpot, Pipedrive, and Apollo (highlighted on Sales, Leads & CRM) automatically log key actions - like email responses, website visits, and demo scheduling - by updating a lead's status in real time and recording conversion events. This level of automation is crucial, especially when you consider that 79% of marketing leads fail to convert due to poor lead status management. These tools also integrate seamlessly with workflow features, taking much of the manual effort out of the process.
Take workflows, for example. HubSpot’s automation can instantly update a lead's status when they take a qualifying action, such as submitting a form or engaging with an email. It also uses lead scoring to assign numeric values based on those behaviors. Once a lead reaches a certain score, the system can automatically enroll them in a sales sequence or create a deal record - no manual data entry required. Businesses that adopt lead scoring often see up to a 70% improvement in lead generation ROI.
Real-time dashboards provide another layer of value. These dashboards turn raw data into actionable insights, allowing teams to monitor metrics like lead source ROI, response times, and pipeline conversion rates as they happen. Funnel visualization tools also help identify where prospects drop off - whether during the MQL-to-SQL handoff or later stages - so you can quickly address bottlenecks. For instance, HubSpot users have reported a 505% ROI over three years and the ability to launch campaigns 68% faster than average.
Attribution reporting is another powerful feature. By linking your CRM to marketing tools and web analytics, you can pinpoint which campaigns deliver the highest lead-to-sale conversion rates. Amanda Sibley, Campaigns Manager at HubSpot, emphasizes the importance of these insights:
"The conversion rate of campaigns throughout each step of your funnel is critical in determining which types of content attract the highest contacts who turn into customers at a higher rate."
Consistency in definitions is also essential. When marketing and sales teams agree on what qualifies as an MQL versus an SQL within the CRM, it ensures conversion metrics are comparable across all channels. Regularly cleaning up duplicate records and tracking how long leads spend in each stage can further highlight where prospects tend to stall. Companies that implement a streamlining sales processes via a CRM often see a revenue boost of up to 28%. These features not only help streamline tracking but also provide a solid foundation for benchmarking your performance against industry standards.
Metric Benchmarks: Industry Averages vs. Target Goals
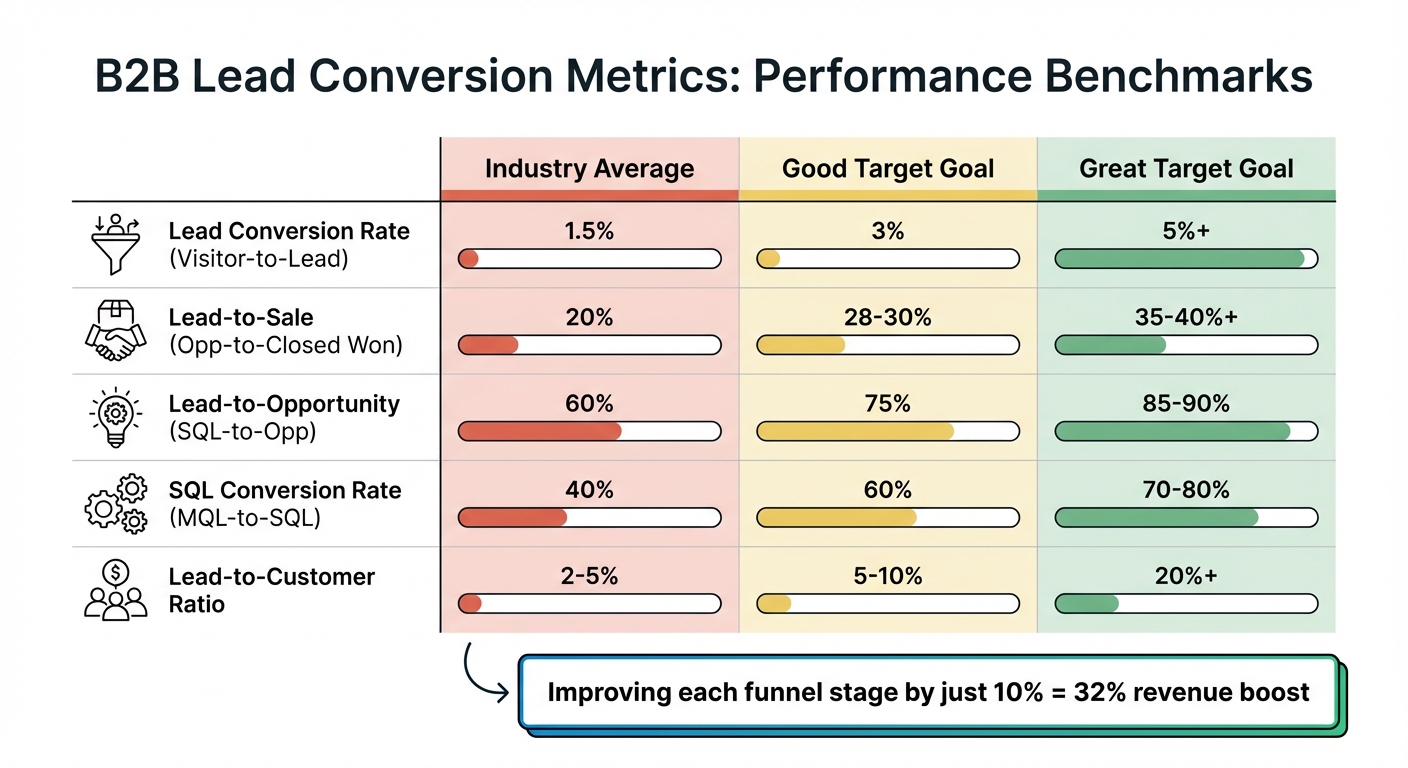
B2B Lead Conversion Metrics Benchmarks: Industry Average vs Target Goals
Once you've identified your key metrics, the next step is to compare them against industry benchmarks. This comparison helps pinpoint where your sales funnel may need improvement. Below is a table highlighting typical performance ranges for five key metrics in B2B companies, along with what qualifies as "good" and "great" performance:
| Metric | Industry Average | "Good" Target Goal | "Great" Target Goal |
|---|---|---|---|
| Lead Conversion Rate (Visitor-to-Lead) | 1.5% | 3% | 5%+ |
| Lead-to-Sale (Opp-to-Closed Won) | 20% | 28-30% | 35-40%+ |
| Lead-to-Opportunity (SQL-to-Opp) | 60% | 75% | 85-90% |
| SQL Conversion Rate (MQL-to-SQL) | 40% | 60% | 70-80% |
| Lead-to-Customer Ratio | 2-5% | 5-10% | 20%+ |
These benchmarks serve as a guide for refining your metrics and improving your overall strategy. Keep in mind that benchmarks can vary based on factors like industry, price points, and traffic sources. For instance, professional services often achieve conversion rates exceeding 7%, while real estate typically averages around 3%. In the B2B SaaS world, companies with self-serve models might see visitor-to-trial rates of 4-8%, whereas enterprise sales models with high-touch processes generally achieve 1-3% visitor-to-demo rates.
The "Golden Funnel" framework suggests that "good" performance often means achieving a 50-100% improvement over average benchmarks. As Convertify puts it:
"You don't need to double your conversion rate overnight. If you improve each stage of your funnel by just 10%, the compound effect is massive." - Convertify
Even modest gains can lead to significant results. For example, improving each stage of your sales funnel by just 10% can translate into a 32% revenue boost. Tools like those offered by Sales, Leads & CRM can help you track and analyze your performance in real time. Their dashboards identify weak points in your funnel, whether it's a low visitor-to-lead rate or a lagging lead-to-sale conversion rate. By leveraging these benchmarks and insights, you can fine-tune your tactics to steadily improve your lead generation and conversion outcomes.
Conclusion
Keeping an eye on these five metrics can turn your sales cycle into a well-oiled machine that drives consistent revenue. By tracking Lead Conversion Rate, Lead-to-Sale Conversion Rate, Lead-to-Opportunity Conversion Rate, SQL Conversion Rate, and Lead-to-Customer Ratio, you’ll uncover exactly where potential customers lose interest or drop off. This insight allows you to fix bottlenecks before they hurt your revenue. Plus, aligning sales and marketing teams around shared metrics can boost year-over-year revenue by 32%, amplifying the overall impact of your sales strategy.
"Lead conversion metrics are key for any sales and marketing team that is looking to better understand if the leads they're driving are resulting in sales." - Laura Caveney, Ruler Analytics
The best part? The right CRM tools make managing these metrics a breeze. With features like real-time dashboards, automated lead scoring, and alerts for high-value prospects, you can spend less time on data entry and more time connecting with qualified buyers. Platforms like Sales, Leads & CRM provide a curated list of top solutions to help you integrate these metrics and build a system that consistently delivers results.
Want to take the next step? Check out the tools on Sales, Leads & CRM and start optimizing your lead conversion process today.
FAQs
How does aligning sales and marketing boost lead conversion rates?
Aligning sales and marketing creates a seamless approach to managing leads, ensuring consistent messaging, and simplifying the handoff between the two teams. When both groups define and agree on what constitutes Marketing-Qualified Leads (MQLs) and Sales-Qualified Leads (SQLs), while monitoring conversion rates at every stage, they can pinpoint issues and make quick adjustments to boost performance.
This partnership also enables marketing strategies - like email campaigns or retargeting ads - to directly complement sales efforts, speeding up the process of turning prospects into solid opportunities. By sharing objectives, utilizing unified data platforms, and holding regular alignment meetings, teams can minimize lead loss, shorten sales cycles, and achieve higher conversion rates.
For tools designed to connect sales and marketing workflows, check out the curated options at Sales, Leads & CRM.
What are the best tools for tracking lead conversion metrics?
Tracking lead conversion metrics is much easier when you have tools that bring together data from your CRM, marketing automation, and advertising platforms into one place. Platforms like Amplitude, Ruler Analytics, and Coupler.io make it possible to track critical metrics like funnel progression, conversion rates, and cost per lead. On top of that, they help pinpoint bottlenecks and link CRM events directly to revenue, giving you insights you can act on.
If you're looking for more options, the Sales, Leads & CRM platform provides a curated list of tools designed to improve lead tracking and sales performance. Some standouts include Apollo for finding leads, Mails AI for automated email campaigns, Instantly for scaling outreach efforts, and HubSpot for detailed reporting. By leveraging these tools, U.S. sales teams can simplify their lead-to-customer process with accurate, real-time data.
Why is the SQL conversion rate important for boosting sales performance?
The SQL, or Sales-Qualified Lead, conversion rate is a key metric that tracks the percentage of qualified leads advancing to the sales-ready stage. It’s a direct indicator of how efficiently your team is guiding prospects through the pipeline and turning them into revenue opportunities.
A high SQL conversion rate usually points to strong coordination between marketing and sales, showing that resources are being directed toward leads with the most potential. Keeping an eye on this metric can reveal bottlenecks in the sales process and help refine strategies to achieve better outcomes.